
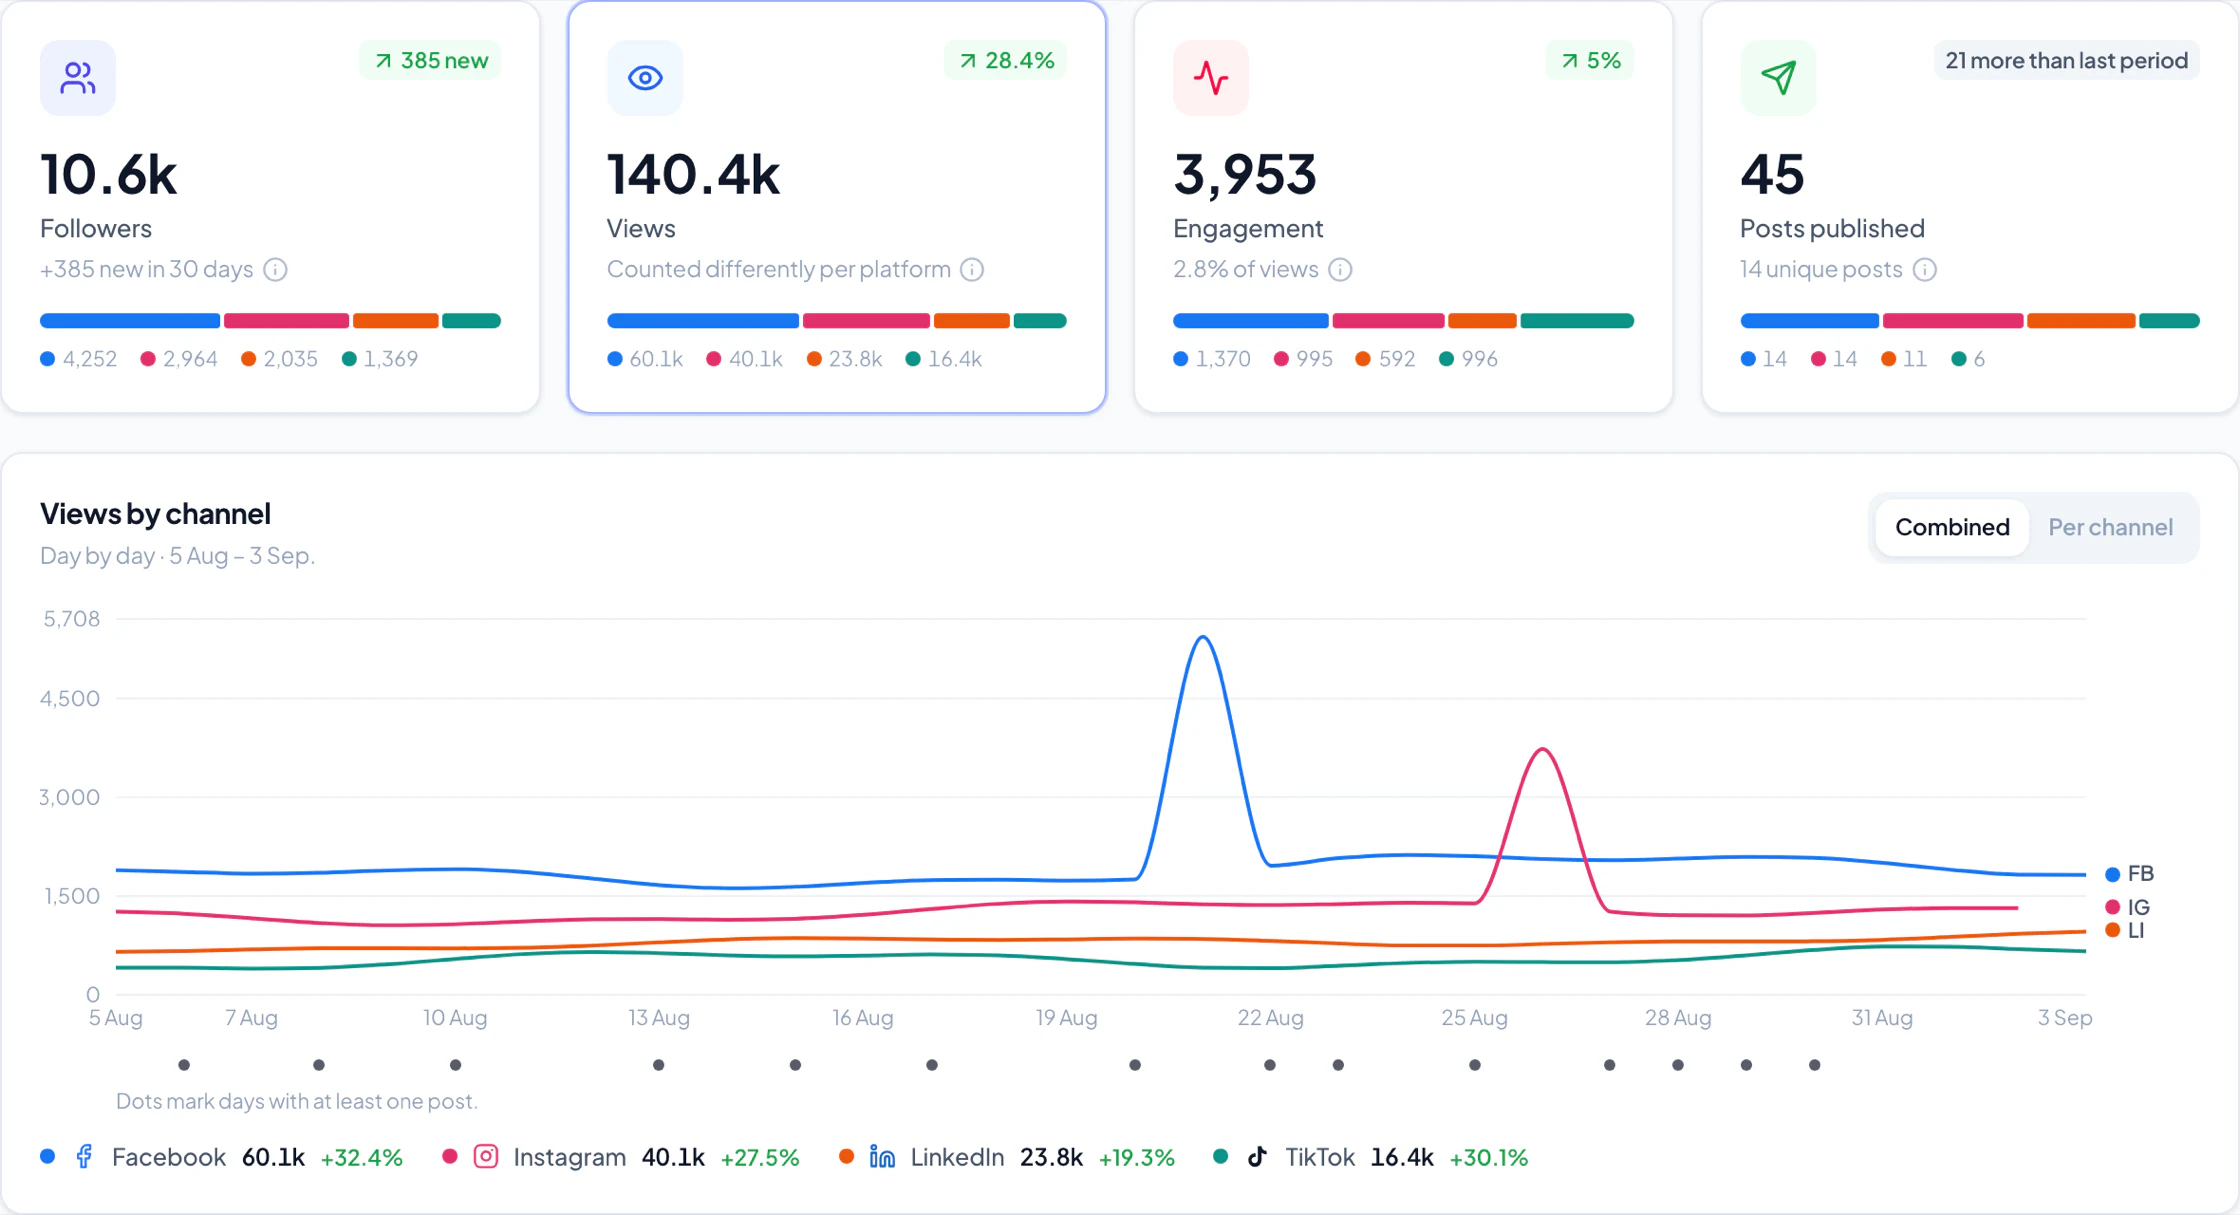
Analytics used to mean opening one channel at a time. It now opens on all of them at once, and the numbers behind it have been rebuilt from the ground up.
Every channel in one view
Four tiles sit at the top — followers, views, engagement, and posts published — each totalled across every channel you have connected, with a bar underneath showing how that total splits between them. Click a tile and the chart below redraws for that number.
Posts published is there on purpose. It is the tile that explains the other three: a quiet month usually has a cause, and the cause is usually further up the page.
The chart draws one line per channel over the same date range, with a dot under every day you published something. Switch it to Per channel when the lines crowd each other. The range picker offers 7, 30 and 90 days, and the page opens on 7 — the shortest window is the one that answers "how is this week going".
Channels side by side
 View full size
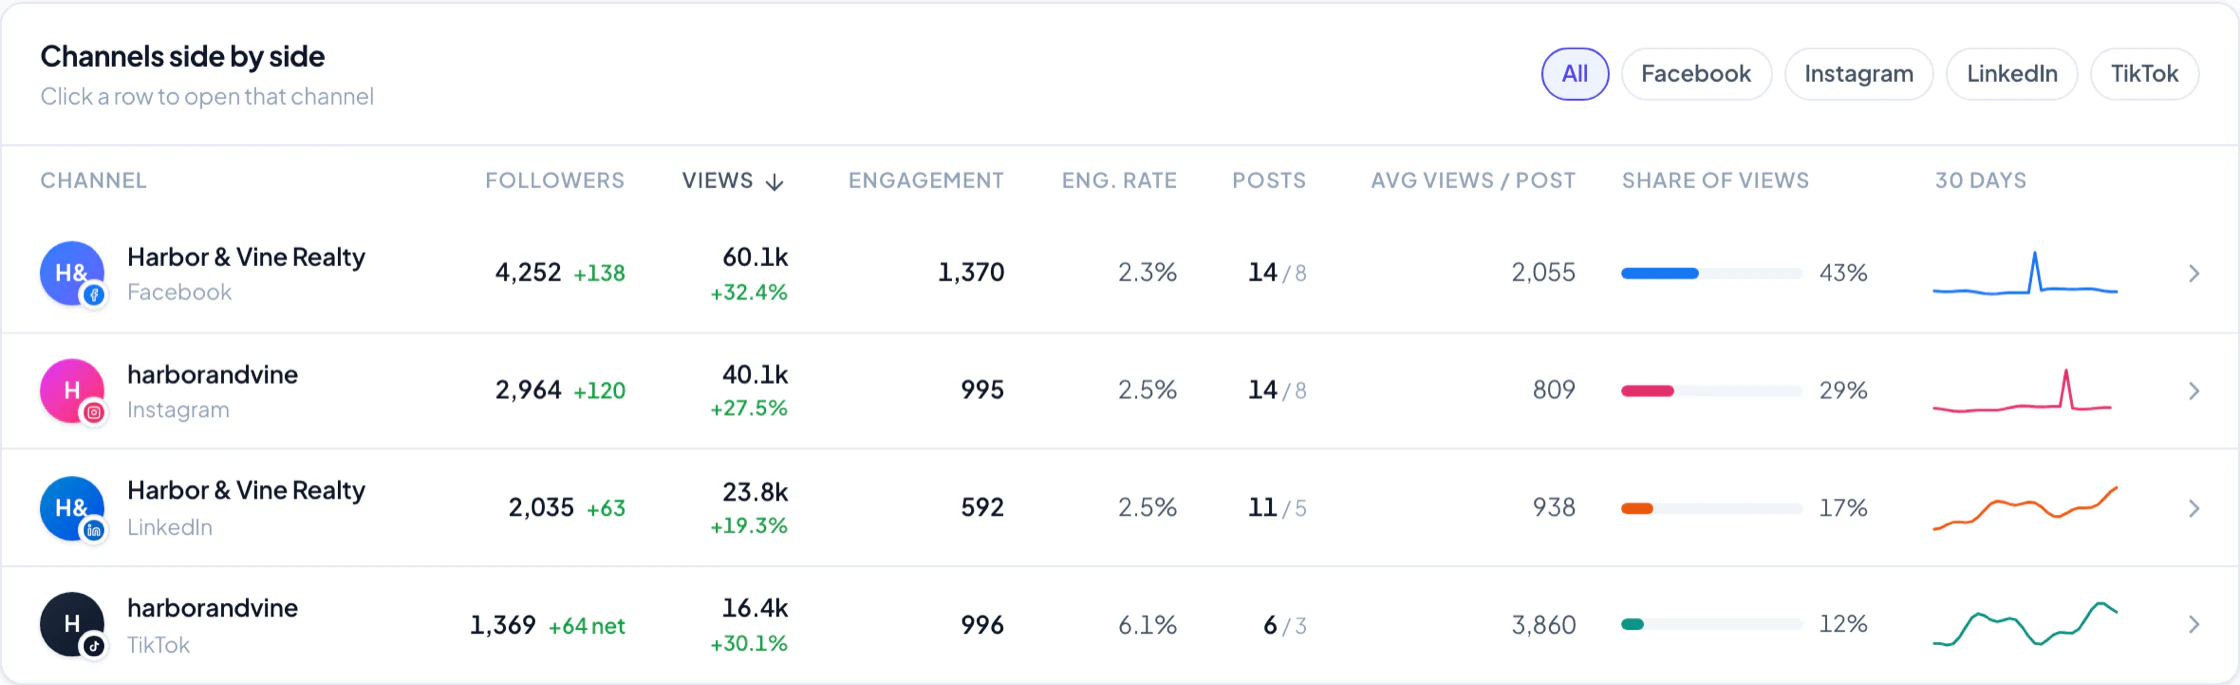
 Underneath, one row per channel, sortable by any column: followers and how many joined, views and the change on the previous period, engagement and the rate it represents, how many posts you published, the average views each one earned, and each channel's share of your total views. Click a row to open that channel in full.
The column that tends to change minds is average views per post. A channel with a modest total can quietly be the one doing the most work per post.
The same post, everywhere it ran
 View full size
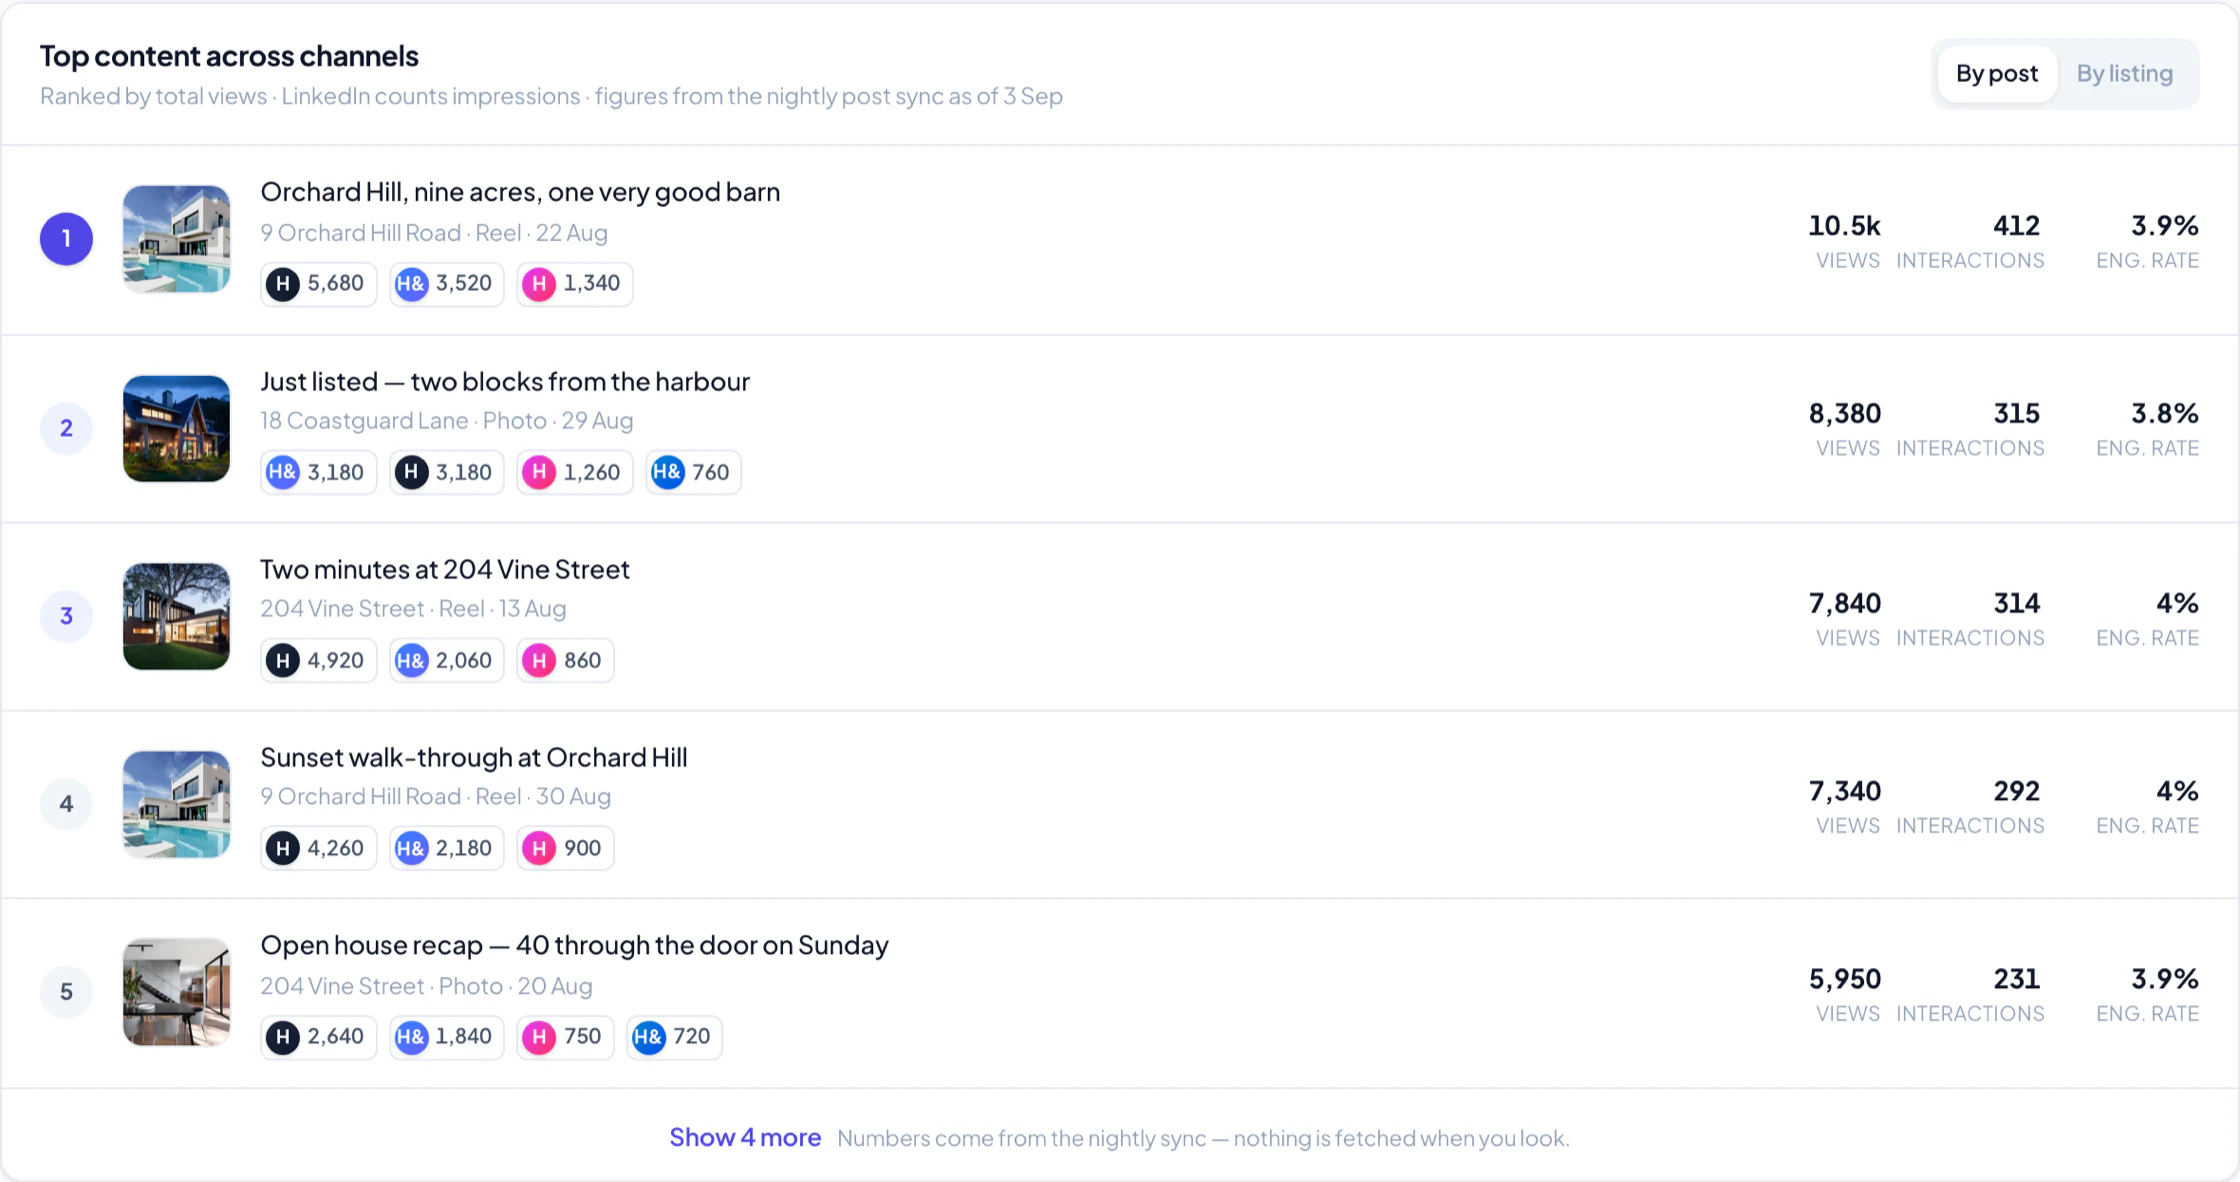
 If you publish one listing to four channels, that is one piece of work, not four. Top content groups it back together: one row per post, a chip per channel showing what each earned, and the totals on the right.
Switch to By listing to roll every post for a property into a single line — useful when a seller asks how their listing is doing, rather than how a particular Tuesday went.
LinkedIn counts impressions where the other channels count views, so the header says so rather than pretending the sum is one clean thing.
Page views you can trust
 View full size
 Meta's daily figures keep moving for hours after midnight. Velisto used to take its nightly snapshot before Meta's day had closed, which captured as little as half the real number — and then reported growth against that half. The snapshot now waits for Meta's day to close and re-reads the previous two days every night, so a figure settles instead of being frozen wrong.
The tile is labeled "page views", because that is what Facebook reports: every time anything from your Page was seen, including older posts, Reels shown to people who do not follow you, and any ads. It is not the views of the posts you published this period, and it was never honest to imply it was. The share coming from non-followers sits underneath, which is usually what explains a page-wide number that dwarfs any single post.
Where a number genuinely is not known yet, you will see a dash rather than a confident zero. An engagement rate of "—" means nothing was measured; it does not mean nobody engaged.
A best time to post, from your own posts
 View full size
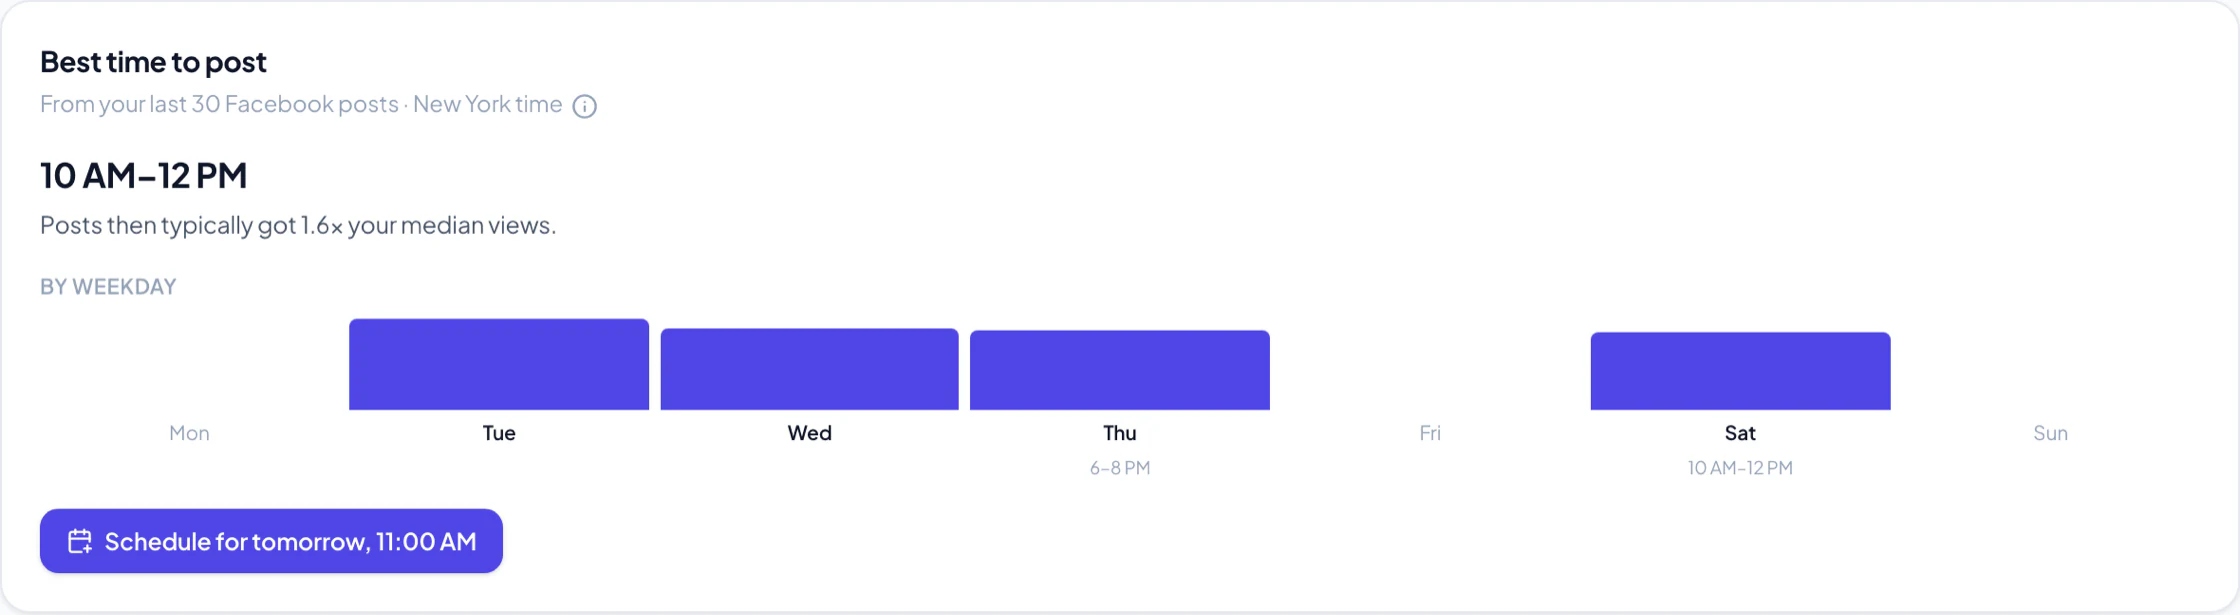
 The recommendation used to name a weekday, which meant one unusually good video could decide your whole week. It has been rebuilt around three rules.
Every post is read at the same age — its first measurement from three days after publishing — so an old post's accrued views never outrank a fresh one's. Each two-hour window is scored by its median rather than its average, so a single viral post cannot carry a slot. And a weekday is only named once it has earned it: at least three posts, spread across at least two different weeks.
What comes out is a window rather than a guess, with how much better posts in it typically did, and a button that opens the composer at that time. The card reads the last 90 days whatever range the page is showing, and stays hidden until there are enough measured posts to mean anything.
What is actually working
 View full size
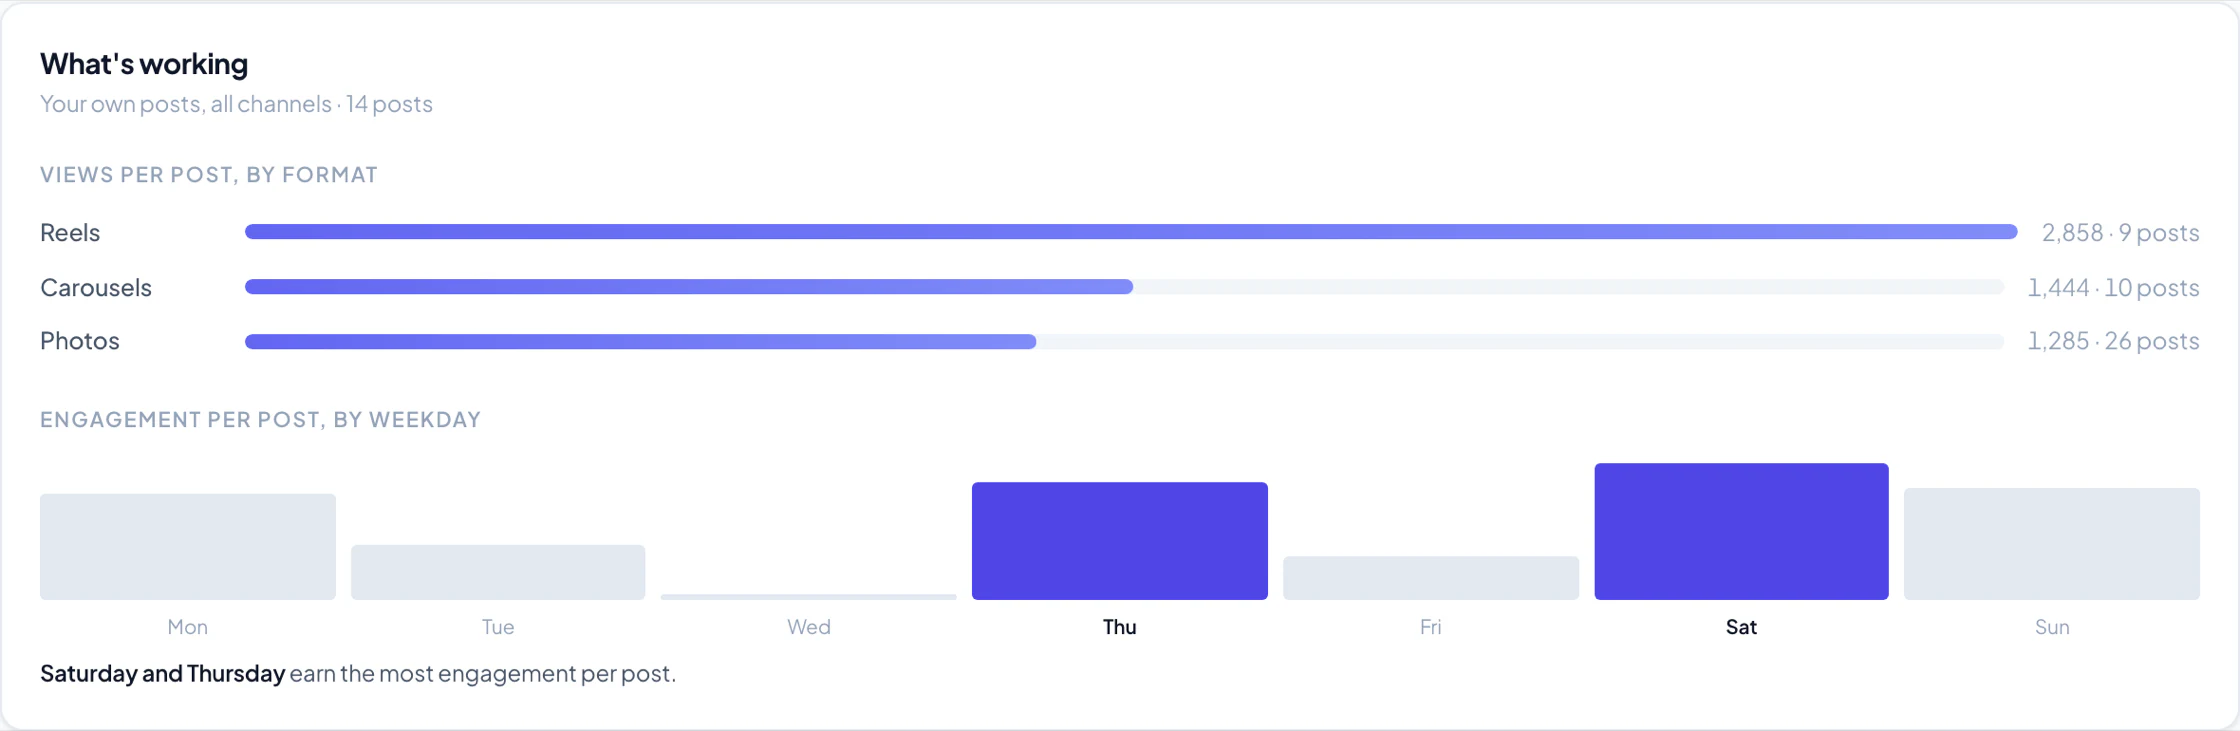
 Two breakdowns answer "what should I make next?" — views per post by format, and engagement per post by weekday. Both are per-post averages taken only from posts that actually reported a number, so a format with nothing measurable stays a gap rather than becoming a zero that reads as failure.
On every channel page
Opening a single channel gets you the same rebuild in more detail. The follower chart marks where measurement began instead of drawing a confident line back through time it never saw. The trend chart overlays the previous period as a dashed line, and days with no data stay as gaps. Reels carry their average watch time. And the connection's health sits on the profile card, so a token that is about to expire says so before it stops working.
Open Analytics to see what it finds for your channels.
Take a look in your workspace.
Sign in to explore the update in your workspace.